RESOURCES
For many years now, we’ve been sharing useful resources and media stories related to our research projects. As a leading Science Laboratory in the San Francisco area, it’s important for us to engage with the community and keep them informed about the incredible work and developments they’re helping to support.


Multi-scale entropy
Background
Researchers in the fields of cognitive neuroscience and neuroscience show more and more interest in the variability of neural signals and ask whether neural variability contains meaningful information (Stein et al. 2005; McDonnell & Ward 2011). One of the challenges researchers face is how to assess noise/variability or complexity in neural signals. In the following, we describe multi-scale entropy, which is a measure that is commonly used to describe the complexity of neural (or other physiological) signals at different time scales.
Simulated time series with different (1/f) noise structure
For the simulations discussed below, four sample time series with a duration of 10 s are generated that differ in their (1/f) noise structure: blue noise (1/f^-1), white noise (1/f^0), pink noise (1/f^1), brown noise (1/f^2). Below the time courses and corresponding spectra are shown. One may also use the neural power fluctuations over time as derived from time-frequency analyses such as wavelet transformations of the signal.

Sample entropy
Sample entropy is a measure of complexity, randomness, or information in time series (Richman & Moorman 2000). In order to calculate sample entropy, the number of times patterns of m succeeding data points occur is counted and the number of times patterns of m+1 succeeding data points occur is counted. A threshold (r) defines what counts as similar patterns because patterns are usually not precisely identical (the threshold is often set to be between 0.1 to 0.2 times the standard deviation of the signal). Sample entropy is then defined as the natural log of the probability of similar patterns with length m relative to the probability of similar patterns with length m+1.

If it is equally probable to observe similar patterns of length m and m+1, the signal is predictable and sample entropy is low. In contrast, if it is more probable to observe similar patterns of length m than similar patterns of length m+1, the signal is more complex and sample entropy is higher. m is often 2. Sample entropy calculated for the four sample noise signals are shown in the figure on the right (r = 0.15, m = 2; matlab code for sample entropy calculation).
Multi-scale entropy
The problem with sample entropy is that it does not take well into account the different time scales that may be present in the time series. In order to calculate the complexity of a signal at different time scales, Costa et al. (2002, 2005) proposed multi-scale entropy. The main part proposed by Costa et al. was to use a coarse-graining approach to derive multiple time scales of the original signal (matlab code for multi-scale entropy calculation). Different time scales (i.e., new time series) are calculatied by averaging successive data points. For scale 2, two data points are averaged. For scale 3, three data points are averaged; etc. (see figure on the below). The coarse-graining approach essentially low-pass filters the signal (larger scales contain mainly low frequency information). Sample entropy is then calculated for each scale (here: r = 0.15, m = 2). The coarse-graining approach could in principle also be applied in combination with other permutation measures, such as permutation entropy.

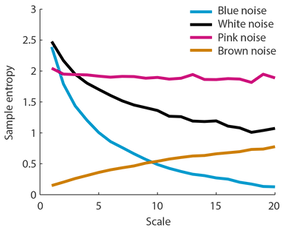
The figure on the left shows the multi-scale entropy (i.e., the sample entropy for different scales) for the four different noise types. It becomes obvious that sample entropy as plotted above without taking into account the different time scales can be misleading. That is, sample entropy was lower for pink noise compared to white and blue noise (see above), but this is clearly only the case for low scales as revealed by multi-scale entropy. In contrast, for higher scales, sample entropy is higher for pink noise compared to the other noise types.
Multi-scale entropy thus seems to distinguish well the different noise types, that is, the different 1/f noise structure in the time series. It might be noteworthy that multi-scale entropy appears independent of the overall amplitude of the signals (althogh this was not exhaustively tested here).
The matlab scripts used to do the simulations can be downloaded here. Please only use under under GNU license. No warranty can be provided. Self-check for errors.